This page provides some examples of pictures created and analyses made from
Scatterometer Climate Record Pathfinder data with simple captions. Click on the image for a larger view. If you want the original image
data from which these images were derived, click on the Image Data,
Data Search, or
Derived Products links. Images are copyright BYU (2000-20010).
 |
QuikSCAT/ASCAT Icebergs (QuikSCAT and ASCAT)
This image at (JD 215, 2009) is one frame of a movie showing the motion of icebergs in the Weddell Sea as observed simultaneously by the Ku-band QuikSCAT and the C-band ASCAT scatterometers. The differences in sensitivity and resolution of the two sensors are apparent. These images were generated in near-real time by the Scatterometer Climate Record Pathfinder.
(Images copyright BYU, 2012.)
|
 |
Deep Horizon Oil Spill (ASCAT)
This (JD 119, 2010) is one of many images of the Deep Horizon oil spill observed by enhanced
resolution C-band ASCAT data. Images such as these were generated in near-real time
by the Scatterometer Climate Record Pathfinder team to
support oil spill tracking at NOAA during 2010.
(Images copyright BYU, 2010.)
|
 |
 |
Simultaneous C- and Ku-band Image of Antarctica (ASCAT and QuikSCAT)
This (JD 217, 2008) false color RGB image was create from a single day of Ku-band data from
QuikSCAT and C-band data from ASCAT. Red is the QuikSCAT H-pol sigma-0 (46 deg incidence angle),
Green is the QuikSCAT V-pol sigma-0 (54 deg incidence angle), and Blue is
the ASCAT V-pol sigma-0 at 40 deg incidence angle. The images reveals the power
of multi-band scatterometry for observing the polar region.
The resulting hues in the image can be interpreted
as follows: Open ocean is blue/green. Dark purple is young first year sea ice.
Older first year and multi-year sea ice are yellow/gold. Glacial ice that has
melted/refrozen is white, with unmodified firn showing as browns and golds.
Icebergs in the sea ice show up as white. (Images copyright BYU, 2010.)
|
|
 |
Simultaneous C- and Ku-band Image of Grenland (ASCAT and QuikSCAT)
This (JD 217, 2008) false color RGB image was create from a single day of Ku-band data from
QuikSCAT and C-band data from ASCAT. Red is the QuikSCAT H-pol sigma-0 (46 deg incidence angle),
Green is the QuikSCAT V-pol sigma-0 (54 deg incidence angle), and Blue is
the ASCAT V-pol sigma-0 at 40 deg incidence angle. The images reveals the power
of multi-band scatterometry for observing the polar region.
Hues visible in the image are as follows: Purple corresponds to land.
Summer melt on the ice sheet periphery is the darker region between the white and
purple regions. Refrozen melt-zone is bright white. Unmelted firn in central
Greenland is brown and gold (Texturing in the lower left portion of the melt zone
is an artifact of the diurnal melt cycle due to using passes at different times of the day.)
(Images copyright BYU, 2010.)
|
|
 |
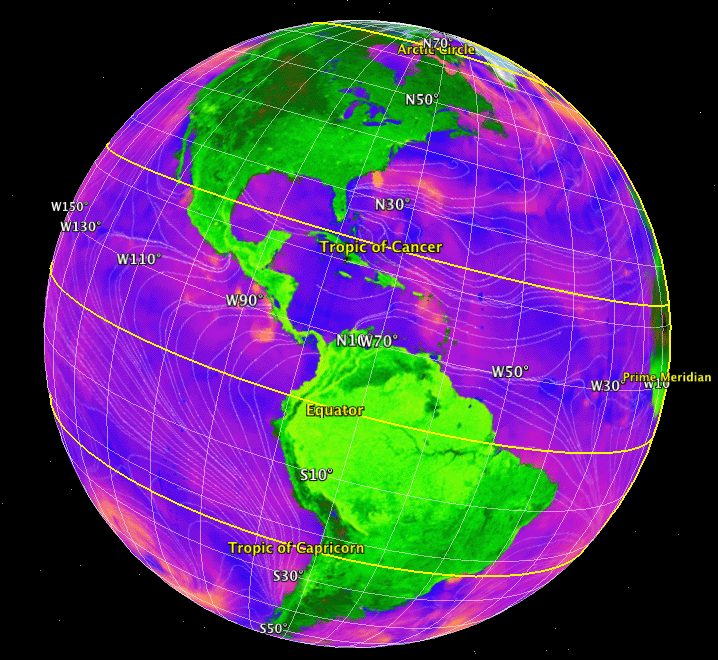
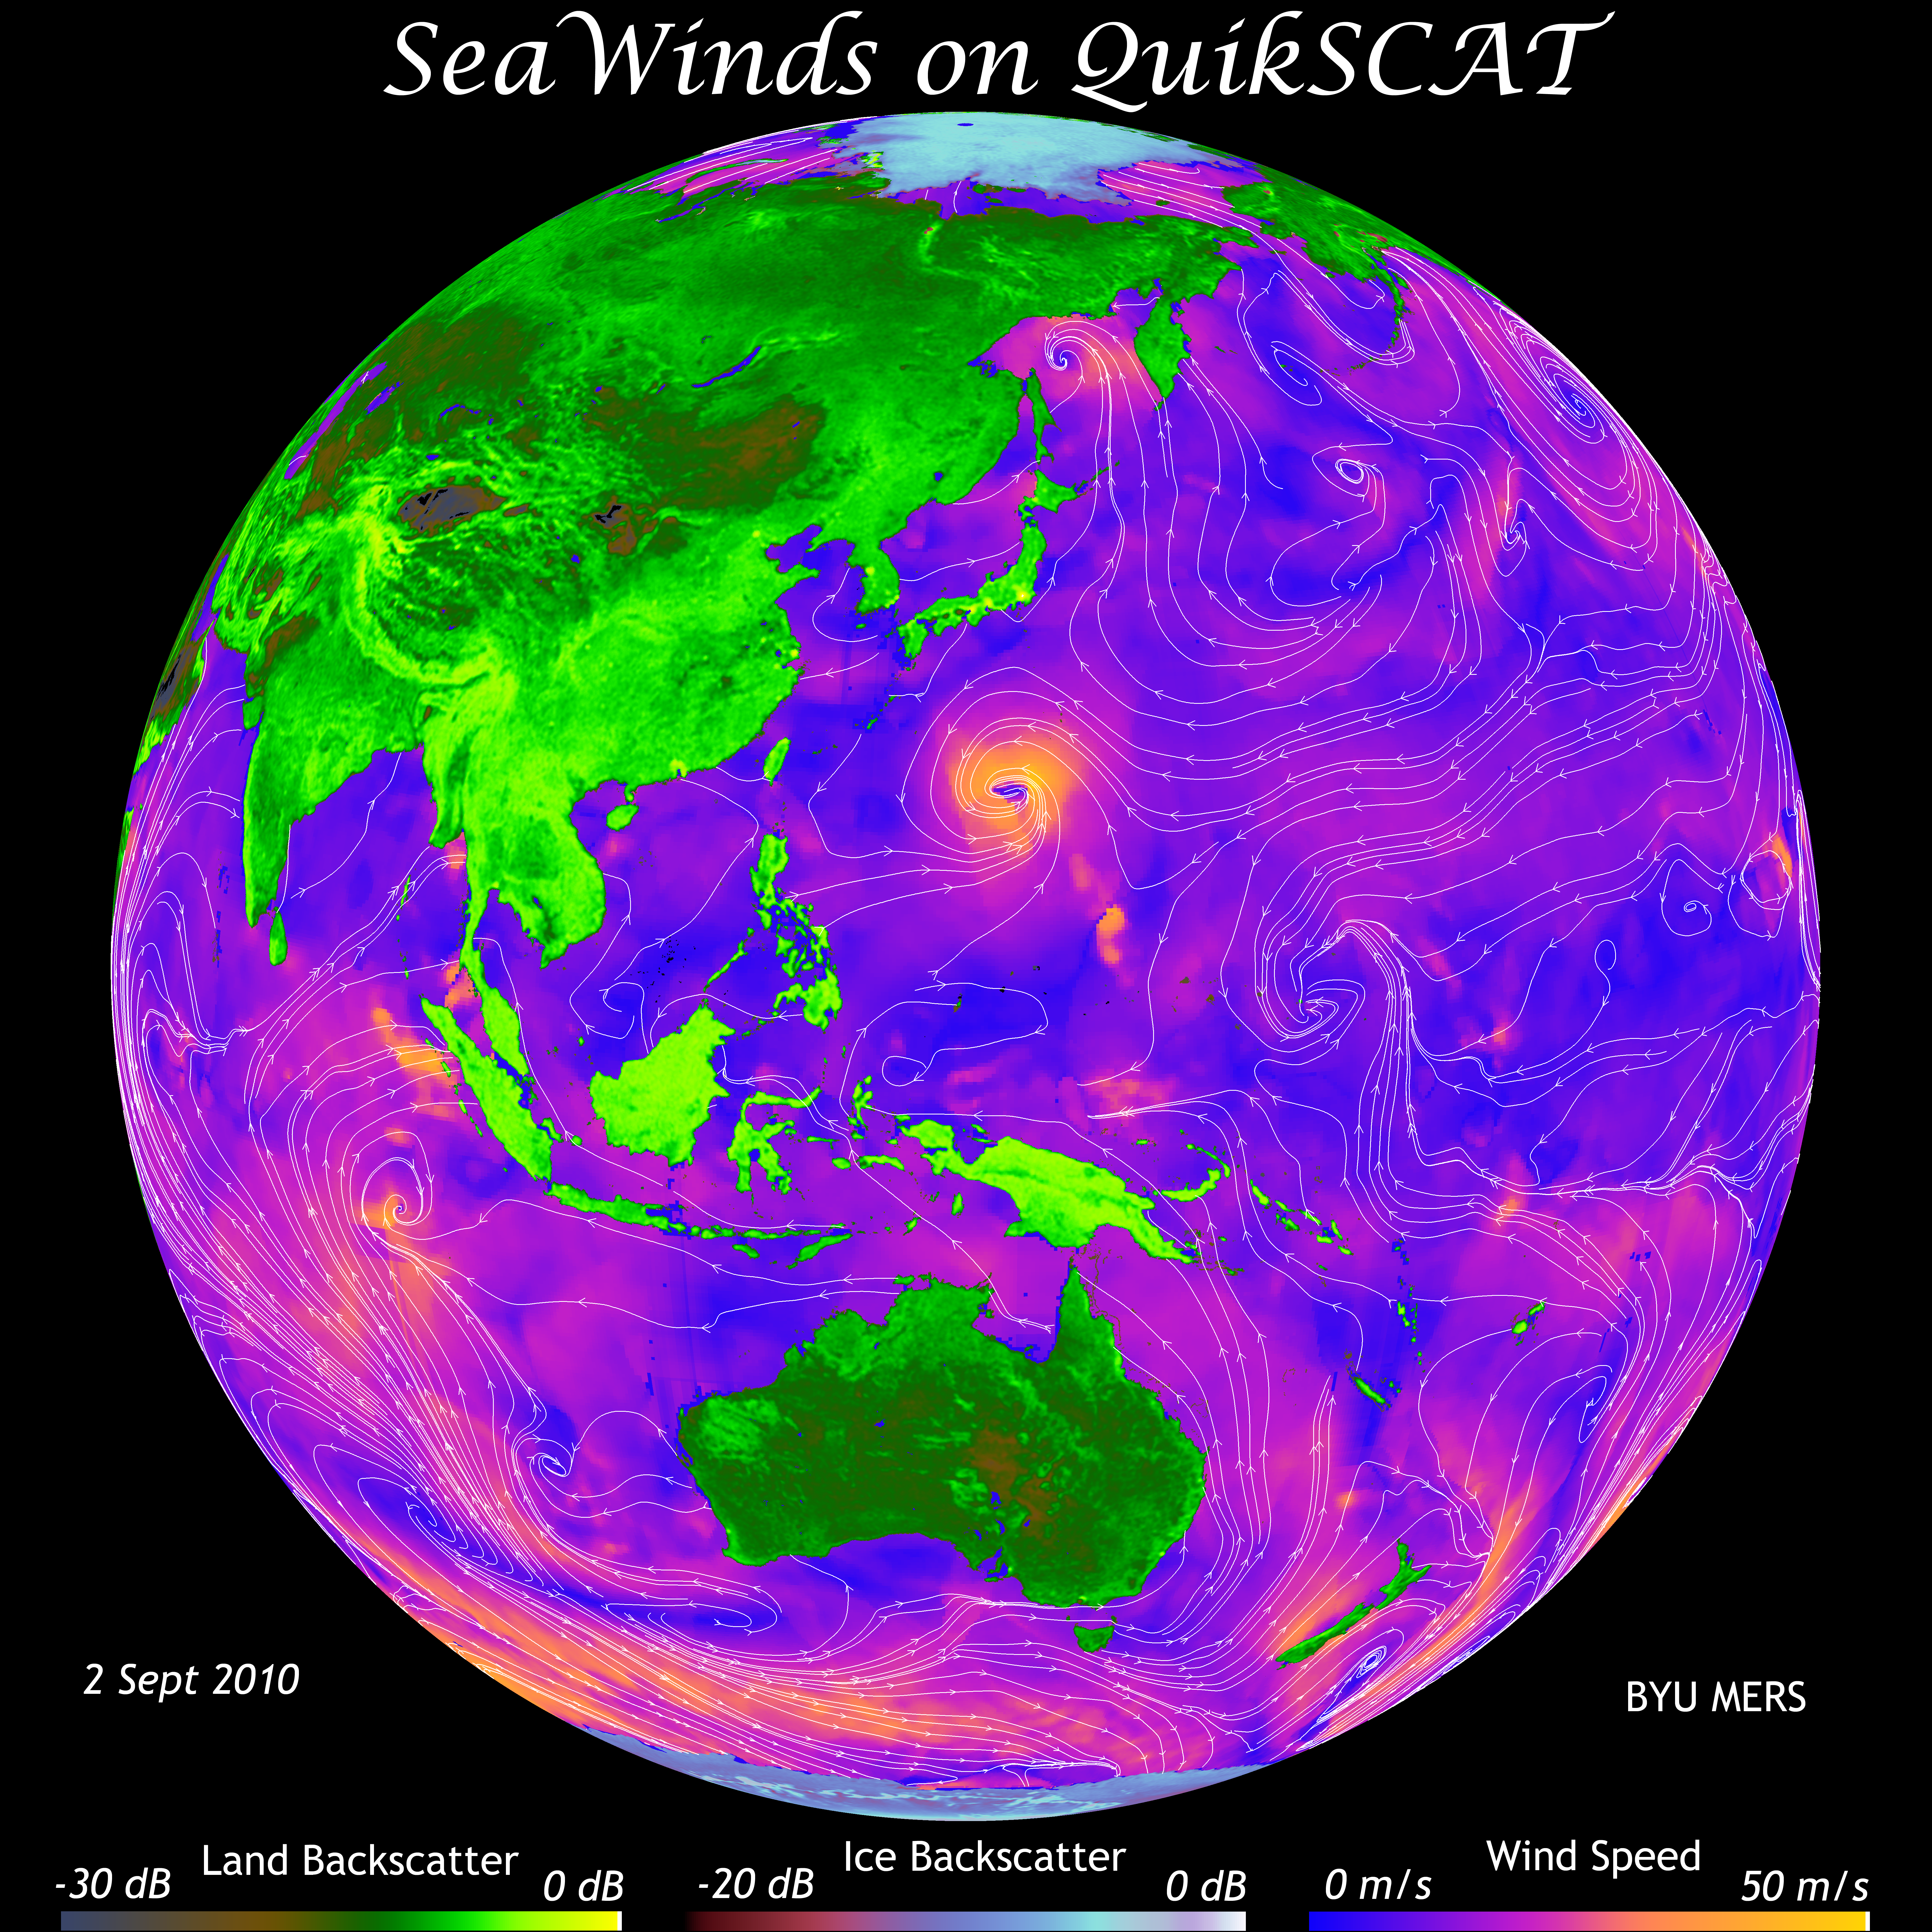
World Winds Poster (QuikSCAT)
Produced entirely from Quikscat data, this image
illustrates the wealth of information available in scatterometer
data. Over the ocean, colors indicate wind speed (blue is low,
yellow high) while the wind direction is indicated with white
streamlines. The land areas are enhanced resolution backscatter
values ranging from high values in tropical vegetation to low
values in the deserts. The sea ice extent at the poles is calculated
from the scatterometer data and is imaged as enhanced resolution
backscatter values. The dry snow zone and melt facies of Greenland
can be clearly distinguished. Click on the image for a poster-size image.
(Images copyright BYU, 2010.)
|
|
 |
Iceberg
Tracking Database (Pathfinder)
Tracking and observation of icebergs from 1978 through to
present has been done using scatterometer data from SeaSat, NSCAT, ERS-1/2, QuikSCAT, and ASCAT.
This image shows Antarctic iceberg tracks from 1978-1992. Currently, ASCAT
images are used for near-real time iceberg tracking. |
|
|
 |
World Winds (QuikSCAT)
Produced entirely from Quikscat data, this image
illustrates the wealth of information available in scatterometer
data. Over the ocean, colors indicate wind speed (blue is low,
yellow high) while the wind direction is indicated with white
streamlines. The land areas are enhanced resolution backscatter
values ranging from high values in tropical vegetation to low
values in the deserts. The sea ice extent at the poles is calculated
from the scatterometer data and is imaged as enhanced resolution
backscatter values. The dry snow zone and melt facies of Greenland
can be clearly distinguished. Click on the image for a larger
view. (Image copyright BYU, 2000.)
|
 |
QuikSCAT observes the world as a KMZ(QuikSCAT)
Produced entirely from Quikscat data for 22 Feb 2006,
this KMZ file
illustrates scatterometer data over the land, ocean, and ice.
This visualization has only limited resolution, but Google Earth
makes viewing fun.
|
 |
KMZ/KML of QuikSCAT icebergs 1999-2009 (QuikSCAT)
This (large!) animated KMZ file
illustrates the positions of large (>5 km) Antarctic icebergs
tracked using QuikSCAT enhanced resolution images. Adjust the
time span of the slider bar to see moving icebergs as a function
of time. QuikSCAT backscatter is shown over the continent.
|
|
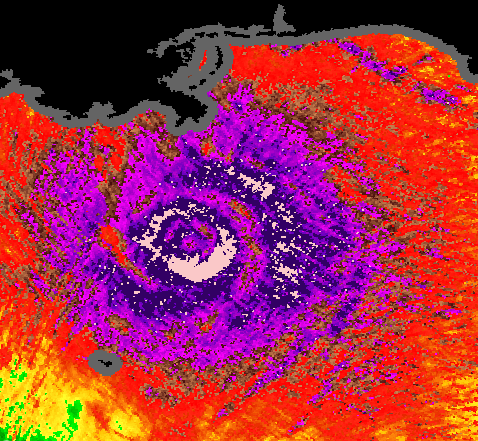 |
Huricanes and Tropical Cyclones(QuikSCAT and SeaWinds)
The QuikSCAT resolution enhancement algorithm used for land imaging
can be adapted to supported ultra-high (2.5 km posting) resolution
(UHR) wind measurement.
This image shows winds speeds around
the eye of Hurricane Katrina on 28 Aug. 2005. UHR winds
provide additional detail about the storm and can aid in storm
tracking. UHR wind images are available in near-real time from
NOAA
and the JPL PO.DAAC. |
|
 |
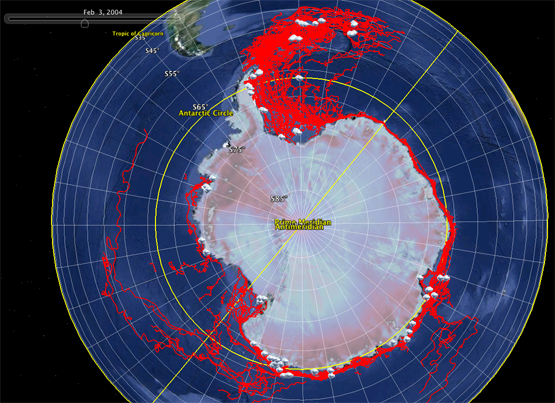
Antartic Ice (QuikSCAT)
A reduced-resolution image
formed from QuikSCAT sigma-0 measurements that demonstrates
the wealth of information contained in the scatterometer
data. This image shows Antarctica and the surrounding sea
ice constructed
from a single day of scatterometer data in July 1999. This
image reveals the presense of iceberg B10A, a 50 km x 100
km "super-berg" which
broke off the Thwaites ice tongue in 1995 and circulated in
the sea-ice pack until breaking up north of South Georia Island
in Jan. 2000. Lost by the U.S. National Ice Center, this iceberg
was rediscovered by QuikSCAT shortly after QuikSCAT's launch.
The grey band around the continent is sea-ice pack surrounding
Antarctica. The variations in sea ice show the circulation
patterns and are due to the snow cover, thickness, and history
of the ice since formation. This information is essential to
understand the effects of the ice pack on the ocean and climate
systems. Antarctica is overed with a thick ice sheet which
appears very bright in the image due to snow crust and refrozen
ice in the snow cover. Details visible in the glacial ice cover
show the locations of ice "hills" and "valleys" which
reveal information about the flow of the ice over the subsurface
topography. In this image, open ocean has been masked off using
the QuikSCAT sea extent algorithm.
|
|
 |
Antartic
Image (NSCAT)
An image formed from NSCAT sigma-0 measurements
that demonstrate the wealth of information contained in
the scatterometer data. This image shows Antarctica and
the surrounding sea ice constructed from 6 days of scatterometer
data in Sept. 1996. The black circle in the center of the
image is where no data was collected owing to NSCAT's orbital
and sampling geometry. The dark band around the continent
is sea-ice pack surrounding Antarctica. The variations
in sea ice show the circulation patterns and are due to
the snow cover, thickness, and history of the ice since
formation. This information is essential to understand
the effects of the ice pack on the ocean and climate systems.
The white, rectangular object in the ice pack on the lower
left of the image is the the B10A 50 km x 100 km "super-berg" which
broke off the Thwaites ice tongue in 1995 and circulate
in the sea-ice pack until breaking up north of South Georia
Island in Jan. 2000. Other large icebergs are also visible
in the image. Antarctica is overed with a thick ice sheet
which appears very bright in the image due to snow crust
and refrozen ice in the snow cover. Details visible in
the glacial ice cover show the locations of ice "hills" and "valleys" which
reveal information about the flow of the ice over the subsurface
topography. In this image, open ocean has been masked off using
the NSCAT sea extent algorithm.
|
|
 |
Global Image (NSCAT)
A full global image as produced from NSCAT data is
(b/w
gif 402K) (color
gif 383K) . The brightest regions are glacial ice sheets
in Greenland and Antarctica as described above. For other
regions, the brightness of the image is related to the
vegetation cover and soil moisture. Tropical rainforests
along the equator in South America, Africa, and Southeast
Asia are relatively bright while desert regions are dark.
Very dry, sandy deserts show up as black in this image.
Some examples are the Empty Quarter in Saudia Arbia, the
Gobi desert in Western China, and the great erg (sand dune)
seas in Sahara desert in North Africa. The light area just
below the wide, dark band in Africa is known as the Sahel.
This area lightens and darkens with the changing season
and drought conditions in Africa. The seasonal radar response
of the Sahel is thought to be a sensitive indicator of
desertification due to global warming and climate change.
Global data images and browse producuts are available for QuikSCAT
and other sensors.
|
|
 |
Tropical Rainforest
(NSCAT)
Tropical rainforests are critical to the climate health
of the world and are thought to contain 1/2 of all the
world's species. Figure 4 [hires
b/w gif 523K] [lores
b/w gif 99K] [color
gif 492K) shows the Amazon rainforest over South America
as observed by NSCAT. Because the radar response is sensitive
to the type and density of vegetation, the scatterometer
data can provide information useful for discriminating
and mapping vegetation. A false color image helps discriminate
general areas of tropical rainforest (blues and purples)
from woodlands and savannah (greens and yellows). Mountains
and degraded farm lands show up as black. [Note: this particular
image is not a classification image.] The
NSCAT data is able to delineate the extent of the tropical
rainforest.
|
|
 |
Tropical Rainforest (TRMM PR)
The Tropical Rain Mapping Mission (TRMM) Precipitation Radar (PR) was designed to measure the vertical
profile of rain at Ku-band. [full res TRMM PR image 6MB]
TRMM PR also made measurements of the surface backscatter at incidence
angles of 0 to 20 deg. At this low incidence angle, below-canopy water shows up more readily than
at mid and high incidence angles (compare NSCAT image above),
which is collected at 40 deg. TRMM PR measurements are also useful for
studying deserts.
|
|
 |
Greenland Radar (SASS and ERS-1)
Seasonal melting has a dramatic effect on radar backscatter which is different
at different frequencies. This image illustrates the variation in radar backscatter
at 40 deg incidence angle at Ku-band (SASS) and C-band (ERS-1). Significant
melting along the periphery of the Greenland ice sheet results in reduced
backscatter during melt. Once refrozen, however, the area has enhanced
backscatter due to volume backscattering from subsurface ice structures.
These Greenland images
are made with enhanced resolution processing.
|


![[full res TRMM PR image 6MB]](gallery/trmm-a-Ama99-final.gif)