
| Home Page | |
| FAQ | |
| Publications | |
| Documentation | |
| Software | |
| Movies | |
| Image Gallery | |
| Image Data | |
| Data Search | |
| Derived Products | |
| Related Links | |
| Contact Us | |
| SCP file site | |
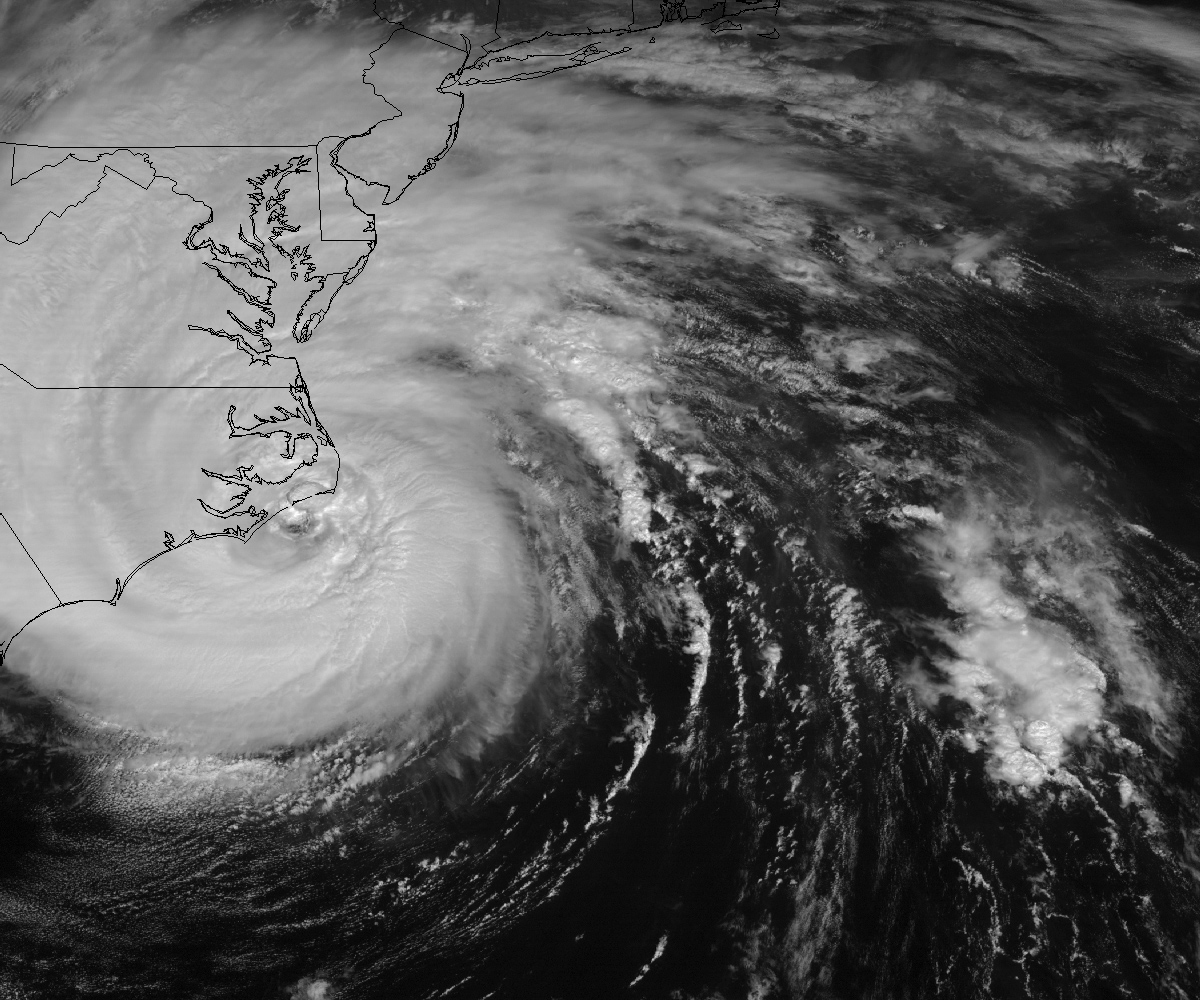
QuikSCAT/SeaWinds Ultra High Resolution Ocean Sigma-0 and Ultra High Resolution Winds Resolution enhancement algorithms such as those used for making enhanced resolution sigma-0 images over land, can also be applied to QuikSCAT and SeaWinds data due the high sampling density. Further, enhanced resolution backscatter images can be generated from single pass, single azimuth look measurements, enabling wind retrieval at the pixel resolution of the imagery. Experimental products for ultra high resolution ocean sigma-0 images and ultra high resolution wind retrieval have been developed at BYU and are currently being distributed. Some sample visualizations of hurricanes are presented here. (Not every pass is shown.) These are browse *.gif images. Example binary files can be obtained from David Long at the Scatterometer Climate Record Pathdinfer (SCP) project. Real-time ultra high resolution wind and related products based on our algorithms are available from NOAA courtesy of Paul Chang. Please note that ultra high resolution winds are an experimental product produced from NRT data and have significant limitations, particularly near coasts. Performance varies across the swath. Ambiguity removal performance is somewhat worse than conventional 25 km winds. Product validation continues and is encouraging but does point to the fact that the high resolution estimates are noisy and can be biased, particularly at low wind speeds. Note that ultra high resolution winds currently have no rain flag, but show clear evidence of rain contamination (e.g. individual convective systems can be distinguished in many places.). Hurricane Isabel Landfall (18 Sept. 2003, 16:01)
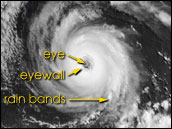
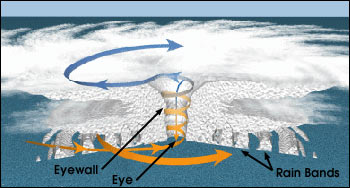
+ Single pass ocean backscatter images have 2.5 km/pixel image resolution and are shown in a cross-track/along-track grid. Along-track is to the right, cross-track is up. Upper left panel is forward looking, Vpol. Upper right panel is after looking, Vpol. Lower left panel is forward looking, Hpol. Lower right panel is aft looking Hpol. * note: To represent 2.5 km winds, these *.gif images are huge (like 4k x 4k pixels). Some browsers can not handle the image sizes and zooming is required to see details. The browse images are reduced resolution versions of these images, while the storm center images are full resolution but are reduced in size, showing only a zoomed in view of the storm center (and still quite large gif images). In the ultra high resolution imagery land is shown in grey while the background field is the high resolution (2.5 km/pixel) SeaWinds/QuikSCAT wind speed estimates derived from the ultra high resolution ocean sigma-0 field. The black arrows show the conventional 25 km MGDR wind directions. The smaller blue arrows (only seen when image is zoomed in) are the average ultra high resolution direction computed within an 8 x 8 (12km X 12km) box centered on the plotted arrow's tail. Blue arrows are spaced 5 km apart. Since radar backscatter is related to wind speed and due to the reduced wind speed in the hurricane eye, the eye tends to be very visible in high resolution sigma-0 images as a low-valued area in the midst of a high backscatter region. Since the radar signal also scatters from rain, which is not symmetric about the eye the apparent location of the eye can be shifted somewhat in the backscatter images. Rain and wind bands can often be resolved in the backscatter and wind imagery. Hurricane Fabian Timeseries (Sept. 2003)
++ Bermuda "hit". Software for reading BINARY high resolution ocean sigma-0 (*.avewr) files and BINARY high resolution wind files (*.WRave3) files are available from the Scatterometer Climate Record Pathfinder (SCP) anonymous file Site in the software/HRsoftware subdirectory. Contact David Long for additional high resolution wind files. |