| Home Page | |
| FAQ | |
| Publications | |
| Documentation | |
| Software | |
| Movies | |
| Image Gallery | |
| Image Data | |
| Data Search | |
| Derived Products | |
| Related Links | |
| Contact Us | |
| SCP file site | |
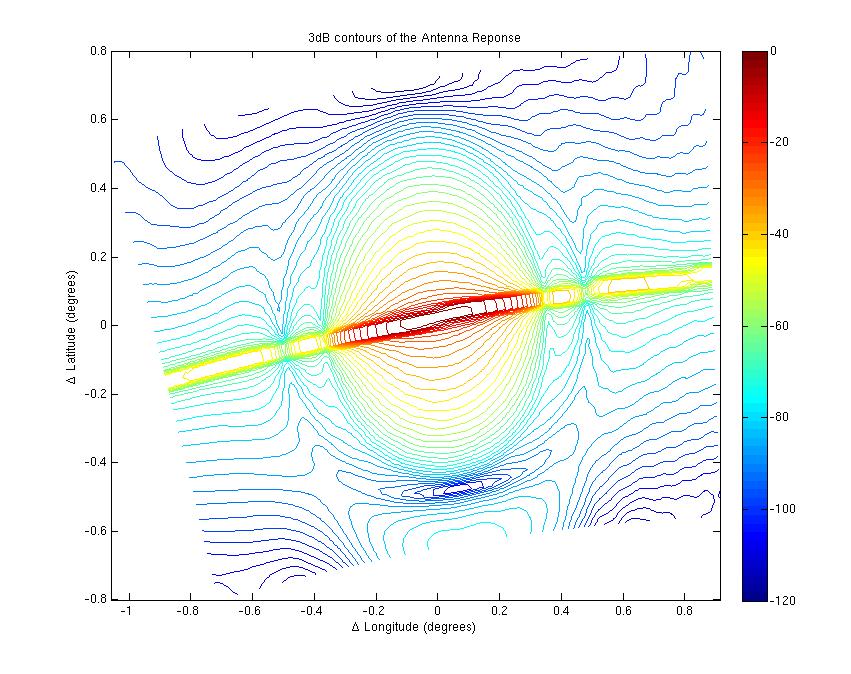
Full Spatial Response of SeaWinds Measurements Imaging applications of SeaWinds on QuikSCAT and ADEOS II are facilitated by applying reconstruction and resolution enhancement algorithms to produce high resolution images of the surface normalized radar cross section (sigma-0). Such algorithms require a description of the spatial response functions of the measurements. The pencil-beam design of Seawinds, coupled with the onboard processing, results in a spatial response function with varies significantly between measurements and is a function of orbit and antenna position.
Computing the spatial response function is complicated and requires significant computation. It requires evaluating the parameters of the radar equation as well as detailed knowledge of the orbit geometry and instrument processing. For this reason we have developed a method of pre-computing, tabularizing and interpolating the complete response function as a function of orbit and antenna position and other necessary parameters. For more details see the paper, M.P. Owen, K.M. Stuart, and D.G. Long, "Ultra-High-Resolution Near-Coastal Wind Retrieval for QuikSCAT ", in "Coastal Ocean Remote Sensing", Proceedings of SPIE Vol. 6680, 26-27 Aug 2007. (PDF file) Separate tables are available for horizontal and vertically polarized slice measurements. Hpol tables are available here while Vpol tables are available here. Software components to interpolate and reconstruct the complete slice spatial response are available for Matlab and C. Additionally example programs illustrate how to use the packages provided. QuikSCAT data files must be acquired separately. Software is available here. Note that the software and tables are copyright Brigham Young University, 2007. The software may be used for non-commerical purposes provided that proper acknowledgements are made and the paper mentioned above is cited. |