Scatterometer Climate Record Pathfinder Movie Gallery
This page provides some examples of data animations made from images created from data from the Scatterometer Climate Record Pathfinder data. This page provides access to specialized movies. A much more extensive movie page is also available. If you want the original image
data from which these images were derived, click on the Image Data,
Data Search, or
Derived Products links. Movies and images are copyright BYU (2000-2021) but may be used with appropriate citation.
 |
QuikSCAT/ASCAT false color polar animations (QuikSCAT and ASCAT)
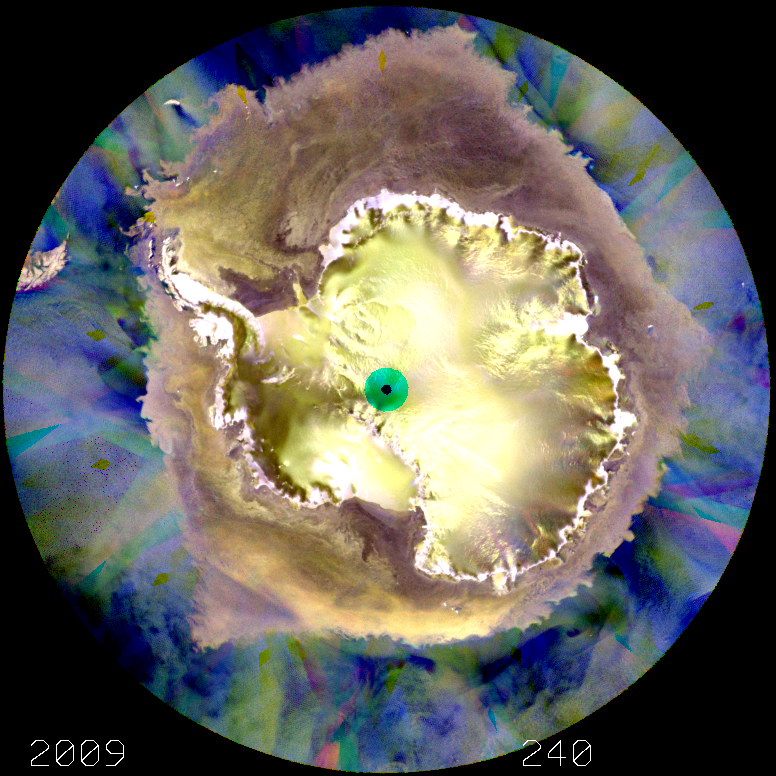
This image at (JD 240, 2009) is one frame of a movie [ MP4 (52 MB) | Animated Gif (382 MB) ] covering three years over Antarctica using
fused Ku-band QuikSCAT and C-band ASCAT scatterometer data. To create this RGB image, Red corresponds to -25 to -7 dB of H-Pol QuikSCAT, Green corresponds to -25 to -7 dB of V-pol QuikSCAT, and Blue corresponds to -22 to -5 dB of V-pol ASCAT normalized to 40 deg incidence angle. Colors reveal differences in the roughness, dielectric constant and volume scattering. The green circle over the pole is an artifact resulting from the differences in coverage of the sensor channels. Note the movement of large tabular icebergs at the bottom and top of the image. These icebergs appear a golden white when the surface is frozen, but darken as the surface melts.
Note: image size has been reduced by a factor of 5 for ease of web display.
(Images and movies copyright BYU 2021, but may be used with appropriate citation.)
|
 |
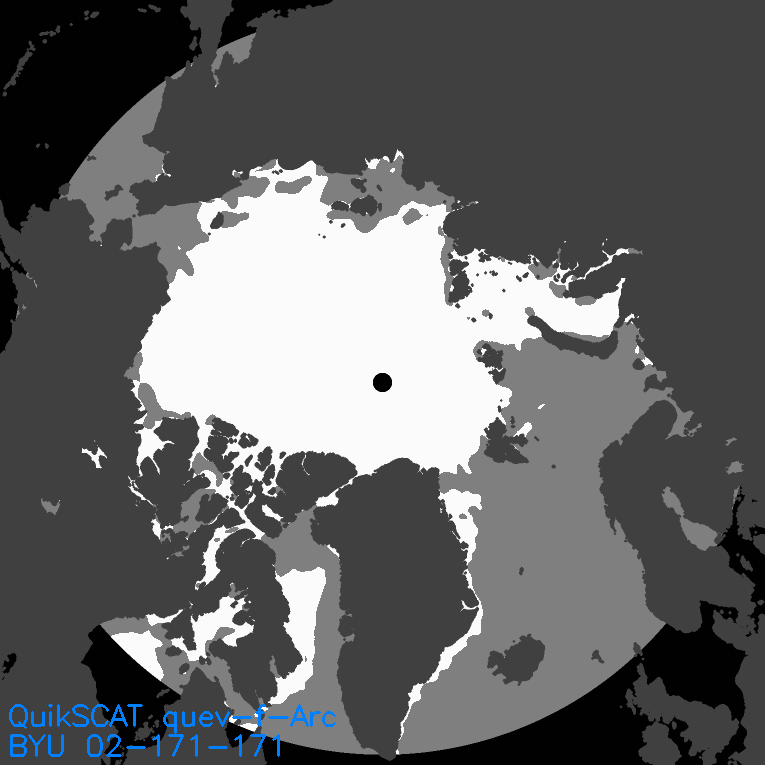
QuikSCAT/ASCAT false color polar animations (QuikSCAT and ASCAT)
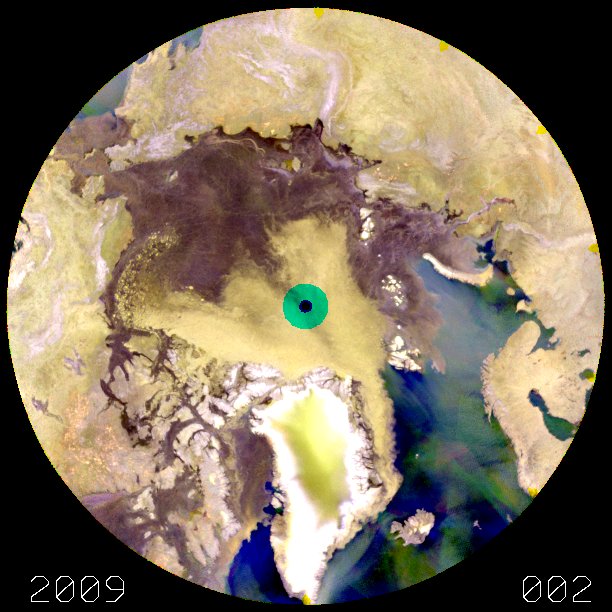
This image at (JD 2, 2009) is one frame of a movie [ MP4 (52 MB) | Animated Gif (382 MB) ] covering three years over the Arctic using
fused Ku-band QuikSCAT and C-band ASCAT scatterometer data. To create this RGB image, Red corresponds to -25 to -7 dB of H-Pol QuikSCAT, Green corresponds to -25 to -7 dB of V-pol QuikSCAT, and Blue corresponds to -22 to -5 dB of V-pol ASCAT normalized to 40 deg incidence angle. Colors reveal differences in the roughness, dielectric constant and volume scattering. The green circle over the pole is an artifact resulting from the differences in coverage of the sensor channels. Tundra regions appear gray but turn light gold when frozen. Moving patterns over the sea ice at the center are due to warm and cold fronts melting and freezing the top surface of the ice.
Note: image size has been reduced by a factor of 5 for each of web display.
(Images and movies copyright BYU 2021, but may be used with appropriate citation.)
|
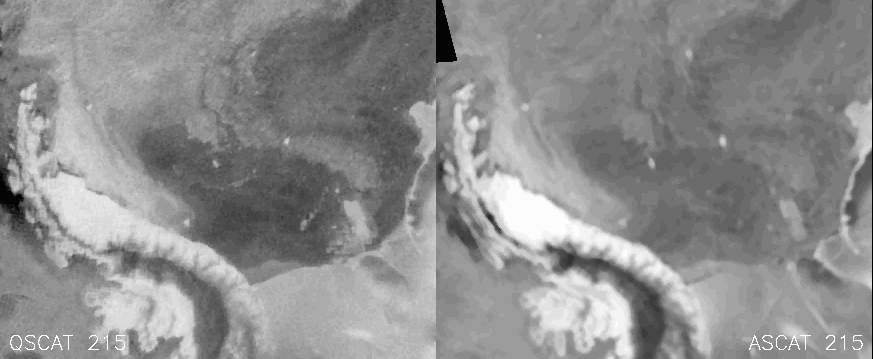 |
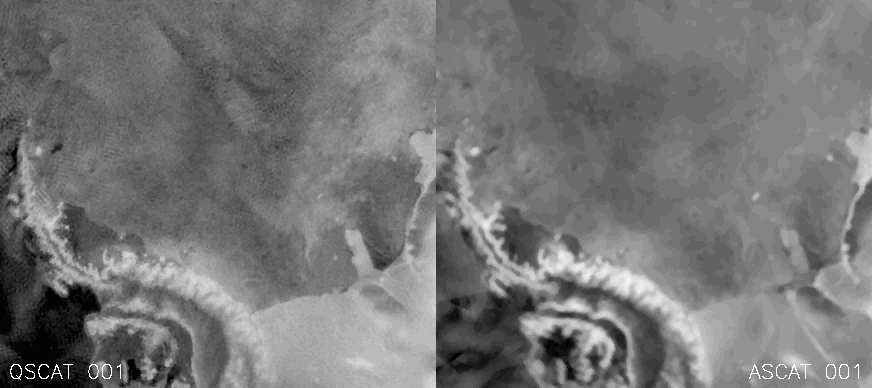
QuikSCAT/ASCAT Icebergs (QuikSCAT and ASCAT)
This image at (JD 240, 2009) is one frame of a movie [ AVI (61 MB) | Gif (22 MB) | MPEG (1,4 MB)] showing the motion of icebergs in the Weddell Sea as observed simultaneously by the Ku-band QuikSCAT and the C-band ASCAT scatterometers. The differences in sensitivity and resolution of the two sensors are apparent. These images were generated in near-real time by the Scatterometer Climate Record Pathfinder.
(Images copyright BYU, 2012.)
|
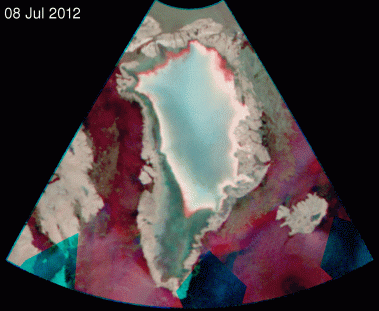 |
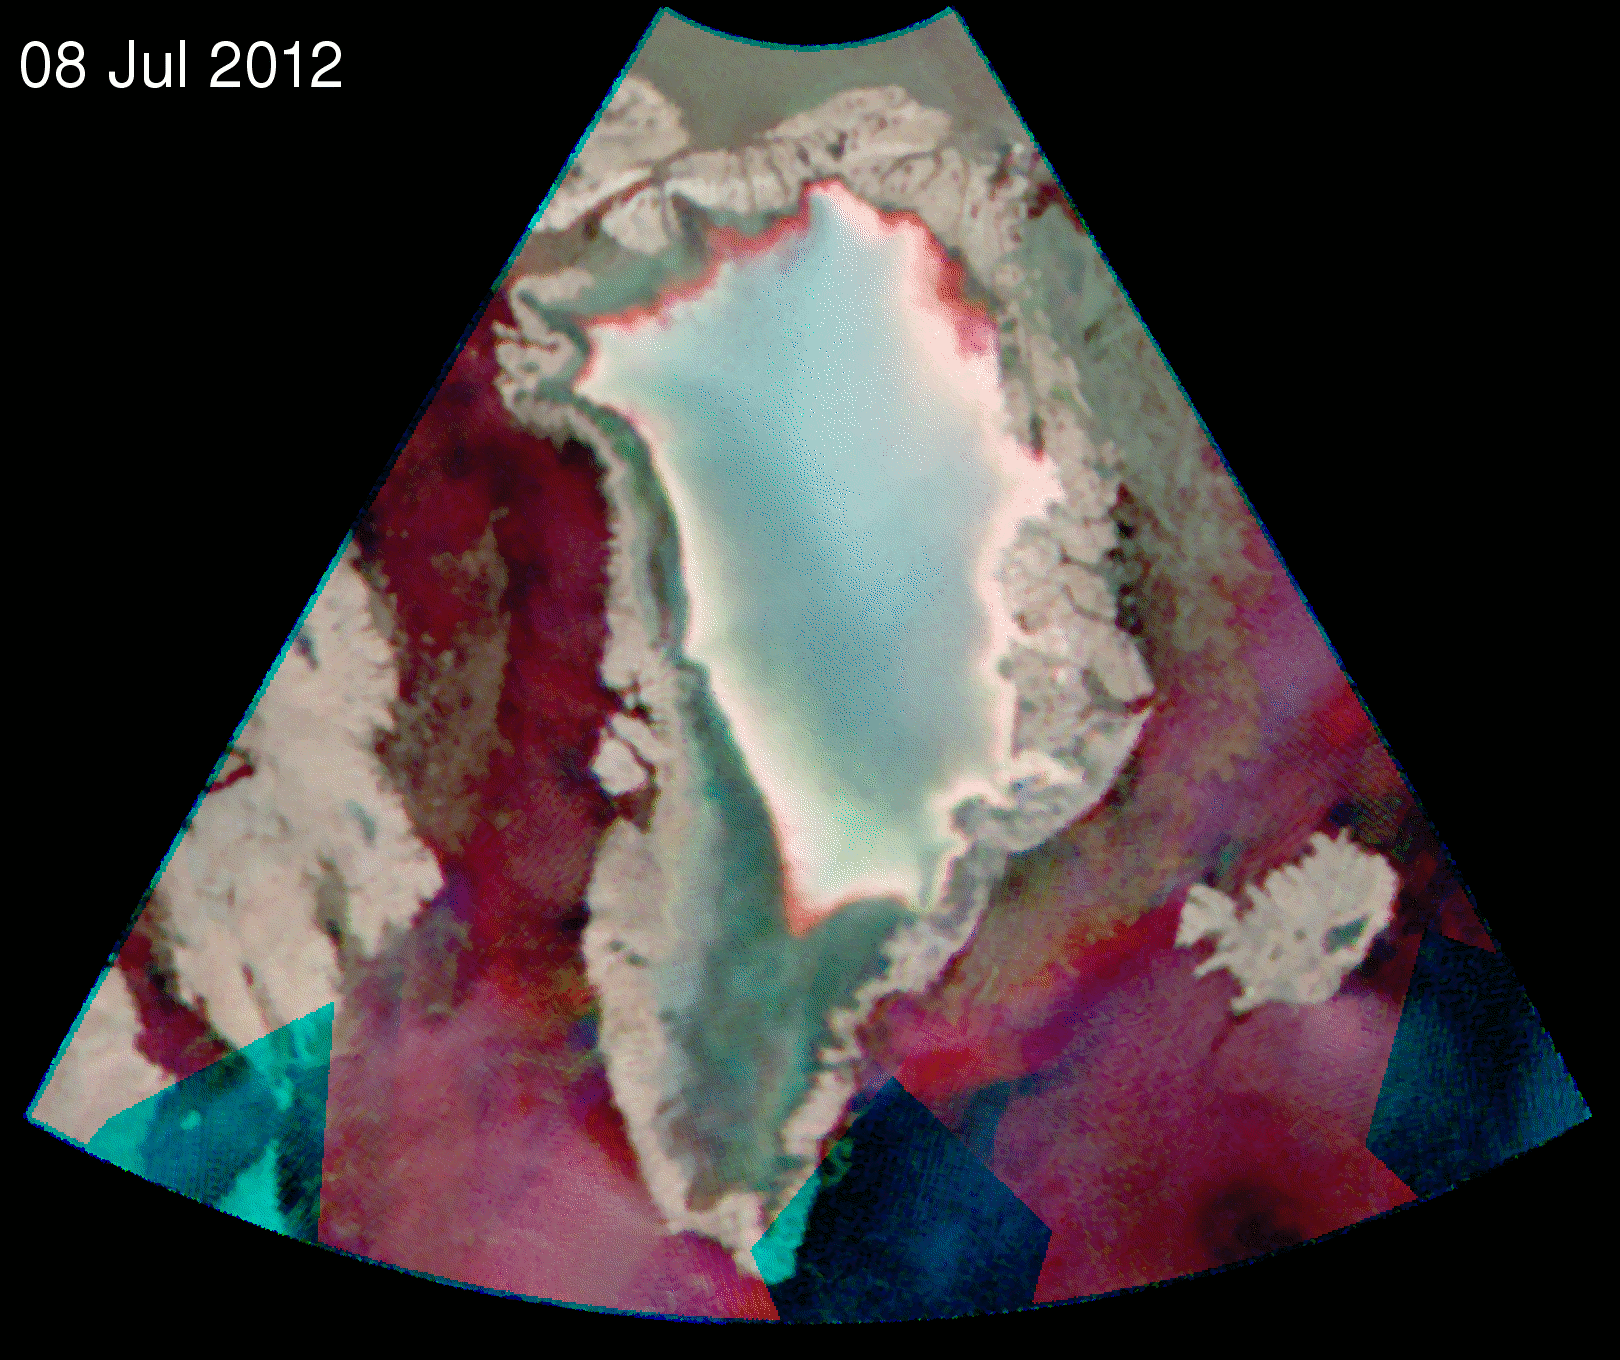
Greenland 2012 melt event (QuikSCAT and ASCAT)
This image at (JD 189, 2009) is one frame of a movie [ Gif (9.8 MB) ] showing the progress of an extraordinary melt event that covered most of Greenlandin 2012. These false color RGB images were created from single day images of Ku-band data from
QuikSCAT and C-band data from ASCAT. Red is the QuikSCAT H-pol sigma-0 (46 deg incidence angle),
Green is the QuikSCAT V-pol sigma-0 (54 deg incidence angle), and Blue is
the ASCAT V-pol sigma-0 at 40 deg incidence angle. The images reveals the power
of multi-band scatterometry for observing the polar region.
Hues visible in the image are as follows: Purple corresponds to land.
Summer melt on the ice sheet periphery is the darker region between the white and
purple regions. Refrozen melt-zone is bright white. Unmelted firn in central
Greenland is brown and gold (Missing data results in colored artifacts on some days. Rapid changes during the day produce noise-like artifacts.)
These images were generated in near-real time by the Scatterometer Climate Record Pathfinder.
(Images and movies copyright BYU, 2012.)
|
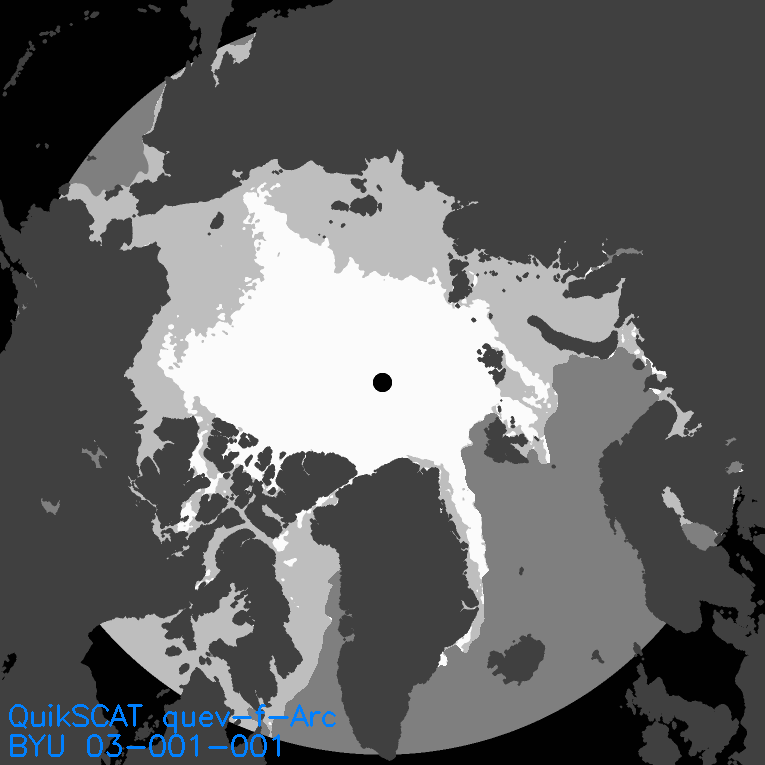 |
QuikSCAT Ice age (QuikSCAT)
This image is one frame of a movie [ animated gif (79 MB)] showing a time series of first year and multiyear sea ice in the Arctic classified from QuikSCAT data. White is MY ice, light grey is FY ice, mid gray is open ocean, dark grey is land, and black is ocean masked out of the processsing. Note that once the summer melt season starts, surviving ice is labeled as MY.
(Images copyright BYU, 2015.)
|
|
