
| News | |
| QuikScat | |
| NSCAT | |
| YSCAT | |
| SAR Research | |
| SCP | |
| CERS | |
| Publications | |
| Software | |
| Studies | |
| Lab Resources | |
| Group Members | |
| Related Links | |
| Contact Us | |
| Getting to BYU | |
Quantifying Vulnerability of Antarctica Ice Shelves to Hydrofracture using Microwave Scattering PropertiesHydrofracture occurs when water trickles into cracks in icebergs or ice shelves and then freezes. When the water freezes, it expands, and the crack gets larger. This cycle continues until, eventually, the ice shelf or iceberg breaks into pieces. By using microwave scatterometry, an ice shelf's vulnerability to hydrofracture can be determined, and all of Antarctica's vulnerability can be indexed, which is the purpose of this project. Alley, et al., 2008 use conclusions from a similar study in Greenland, but tweaks the algorithm so that it is applicable to Antarctica. In the Greenland study, a relationship between the microwave backscatter in the winter and how many melt days there were in a year was successfully proven, and this relationship can be used to determine hydrofracture susceptibility. This general relationship is that as melt days increase, backscatter also increases. This can be seen by examining the four different types of snow:
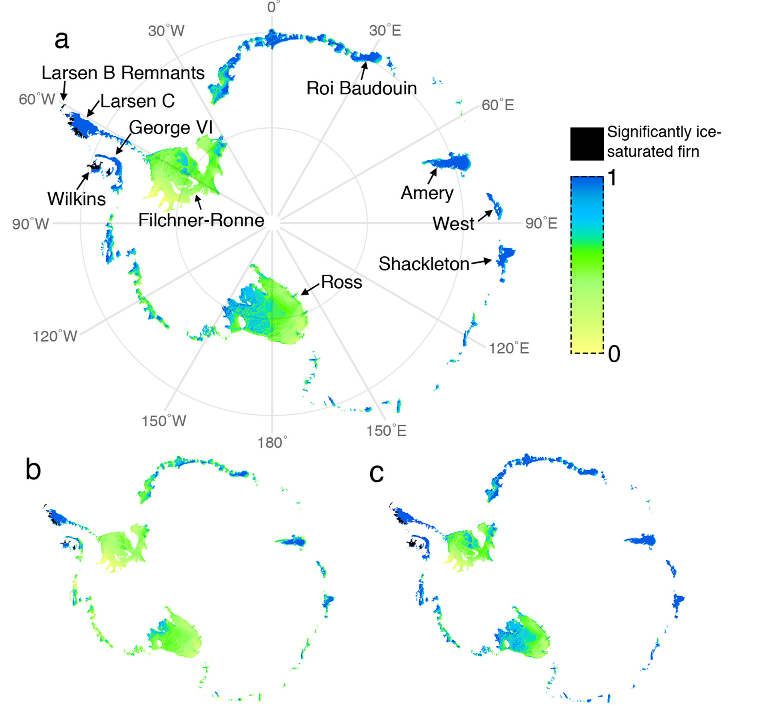
In the Antarctica study, the area of interest is lower in altitude and the elevation can be ignored. The focus on the summer climate is more important. As seen in the figure, when there is a high amount of melt days, ice lenses form, and backscatter decreases, as seen in the bare ice. The reason the backscatter decreases, instead of is because the porous firn (which normally leads to backscatter) is saturated with ice. Ice lenses aid in the creation of pooling melt water, which are a necessity to hydrofracture. Therefore, in areas where melt days are high but backscatter is low, the chance of hydrofracture is high. This study used four sensors to gather backscatter data: ESCAT 1, ESCAT 2, QuikScat, and ASCAT. The ESCAT scatterometers and the ASCAT scatterometer is C-band, and the QuikSCAT scatterometer is a Ku-band. All of the data was then processed using the Scatterometer Image Reconstruction (SIR) algorithm to create a high resolution backscatter image time series. From this a hydrofracture index is derived that measures how much hydrofracturing is occuring. The hydrofracture index includes the ratio between backscatter and annual melt days. However, clear lines must be drawn between levels of saturation, which doesn’t allow for sub-classification. To make the index, the ratio between backscatter and annual melt days is mapped, with lines of best fit used to generalize the melt period for each location. Figure 1 below shows the index and the indexes with plus or minus two standard deviations. Backscatter values are affected by:
However, most of these are small errors that are not accounted for because there effects are negligible. For those that need correction, error deviations were applied. Monitoring hydrofracture is becoming increasingly important as more and more ice shelves experience mass loss. The changing amount of hydrofracture reflects the changing climate. By monitoring hydrofracture, we can know how much of Antarctica could be changed, and therefore can predict the effects it has on other aspects of the climate, like ocean productivity and wildlife. 
Figure 1. Scatterometer-derived hydrofracture index for major ice shelves in Antarctica. For more information, please click here Reference: K.E. Alley, T.A. Scambos, J.Z. Miller, D.G. Long, M. MacFerrin, “Quantifying vulnerability of Antarctic ice shelves to hydrofracture using microwave scattering properties,” Remote Sensing of Environment, https://doi.org/10.1016/j.rse.2018.03.025, Vol. 210, pp. 297-306, 2018. |