
| News | |
| QuikScat | |
| NSCAT | |
| YSCAT | |
| SAR Research | |
| SCP | |
| CERS | |
| Publications | |
| Software | |
| Studies | |
| Lab Resources | |
| Group Members | |
| Related Links | |
| Contact Us | |
| Getting to BYU | |
Global Ice and Land Climate Studies Using Scatterometer Image DataThe original application for scatterometers was for them to measure winds by monitoring the scattering of radar waves. However, this data has many applications beyond wind, one of which is to determine seasonal and interannual variability and the possible relations to climate change. Now that the Scatterometer Climate Record Pathfinder (SCP) is producing and publishing non-ocean scatterometry imagery and data, these applications of scatterometry can be explored. Applications include:
We can get more applications out of scatterometers by configuring them in different ways. Some different methods of configuring include:
Furthermore, because scatterometers are so accurate, relatively small changes can be examined. Properties that change backscatter include:
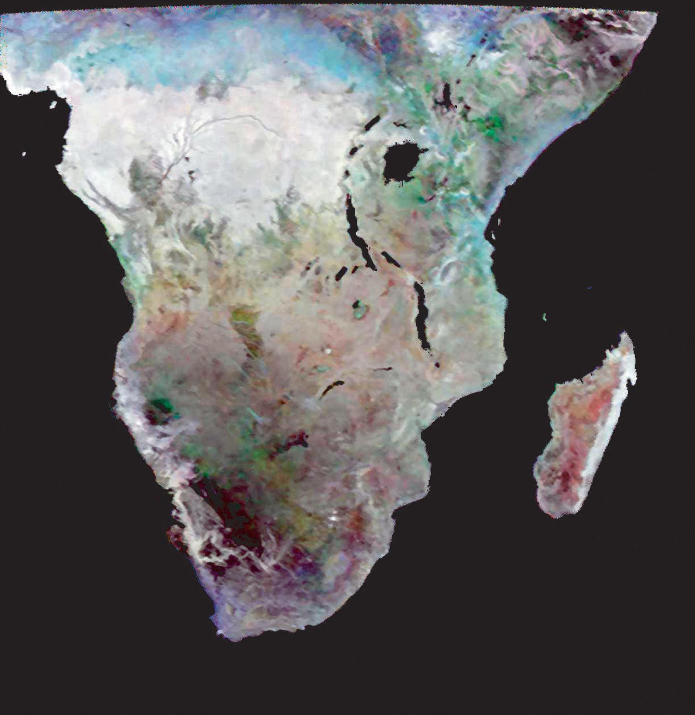
 Figure 1 shows how scatterometers were able to determine different types of vegetation in Africa. References: Long, D. G., M. R. Drinkwater, B. Holt, S. Saatchi, and C. Bertoia, Global ice and land climate studies using scatterometer image data, EOS Transactions, AGU, 82(43), 503, 2001. Long, D. G., M. R. Drinkwater, B. Holt, S. Saatchi, and C. Bertoia, Global ice and land climate studies using scatterometer image data, EOS Transactions Electronic Supplement, AGU, https://www.agu.org/eos_elec/010126e.html, 2001. For more information, please go to https://agupubs.onlinelibrary.wiley.com/doi/abs/10.1029/01EO00303 |