Studies of Tropical Vegetation
The MERS research group has been actively involved in research
involving the Amazon, Congo and other tropical rain forests. As
part of these studies both Seasat scatterometer (SASS) and ERS-1
scatterometer (Escat) data have been processed with the SIRF resolution
enhancement algorithm. This algorithm was developed by the MERS
group to generate enhanced resolution scatterometer imagry.
SIRF images have demonstrated the ability to enable the discrimination
of tropical vegetation types and have been very useful in polar
ice studies.
SIRF generates images of A and B which are related to the normalized
radar cross section Sigma-0 by Sigma-0(db)=A+B(theta-40) where theta
is the incidence angle of the measurements. The resolution of the
resulting images is ~4-5 km for SASS, 25-30 km for ERS-1/2, and
4-8 km for NSCAT. Previous techniques were limited to the intrinsic
resolution (50 km) of the scatterometer.
Sample images over the Amazon rainforest are avilable below.
Want to know that the world looks like by radar?
NSCAT used 14 GHz (Ku-band) to observe the Earth.
World view from NSCAT data:
Display NSCAT b/w
world image (size=402k)
Display colorized
NSCAT world image (size=383k)
Seasat SASS also used Ku-band.
Global view of Ku-band Sigma-0 at 40 deg incidence angle
(size=75k) Display SASS image
The European ERS-1 and ERS-2 AMI scatterometers used 5.3 GHz (C-band).
Global view of C-band Sigma-0 at 40 deg incidence angle
over land with wind Overlay (size=162k)
Display ERS-1 image
Low resolution SASS image of the Amazon: (size=122k)
Display low resolution
Image
SIRF enhanced resolution SASS image of the Amazon: (size=157k)
SIRF Image
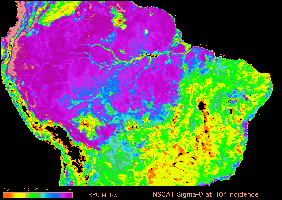
SIRF enhanced resolution NSCAT image of the Amazon:
Display small
b/w image (size=159k)
Display b/w image
(size=523k)
Display colorized
image (size=492k)
Comparing the SASS and NSCAT images, the changes in the past two
decades can be evaluated. In this image, smaller changes (1 sigma
difference std) have been highlighted in yellow and larger changes
(more than 2 sigma differences) are in pink. Changes correlate well
with highway and settlement development.
NSCAT-SASS change image of the Amazon:
Display image
(size=193k)
Other vegetation/land images
SASS A image of Africa and the Congo (size=399k)
Display image
Small ERS-1 Africa image time series (size=26k)
Display image
Alaska SASS image time series (size=154k)
Display colorized image
Alaska NSCAT images (size=293k)
Display b/w image
NSCAT image of Japan (size=53k)
Display b/w
image
Some of the most spectacular images are of the polar regions...
Images of Antarctica
Images of Greenland
Related Papers
Resolution Enhancement
of Spaceborne Scatterometer Data
D.G. Long, P. Hardin and P. Whiting, IEEE Trans. Geosc. Remote
Sens., Vol. 31, No. 3, pp. 700-715, May 1993.
Vegetation
Studies of the Amazon Basin Using Enhanced
Resolution Seasat Scatterometer Data
D.G. Long and P. Hardin, IEEE Trans. Geosc. Remote Sens., Vol.
32, No. 2, pp. 449-460, March 1994.
MERS Bibliography
|


