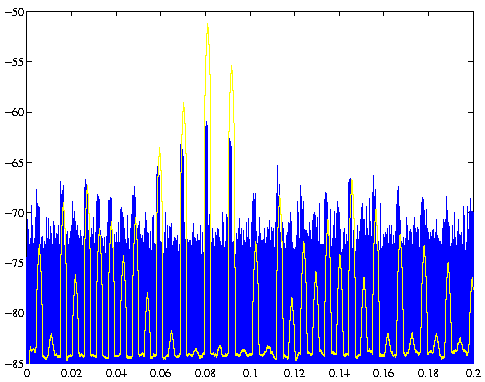

Plot of the triangle waveform overlayed on the CGS raw power. The plot shows that the peak of the triangle occurs at the end of the pulse, thus determining exact timing. Since the pulse is 1.5 ms long, the middle of the pulse is 0.75 ms before the triangle peak, and the beginning of the pulse is 1.5 ms before the triangle peak. (The triangle waveform has been scaled in amplitude for graphical purposes.)